How Much Impact Does the President Have on Stocks?
October 2, 2020
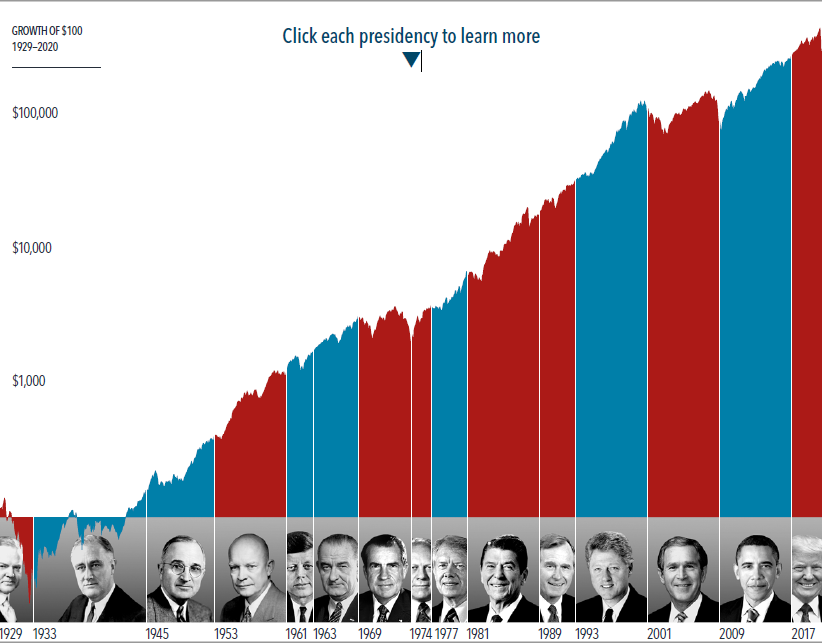
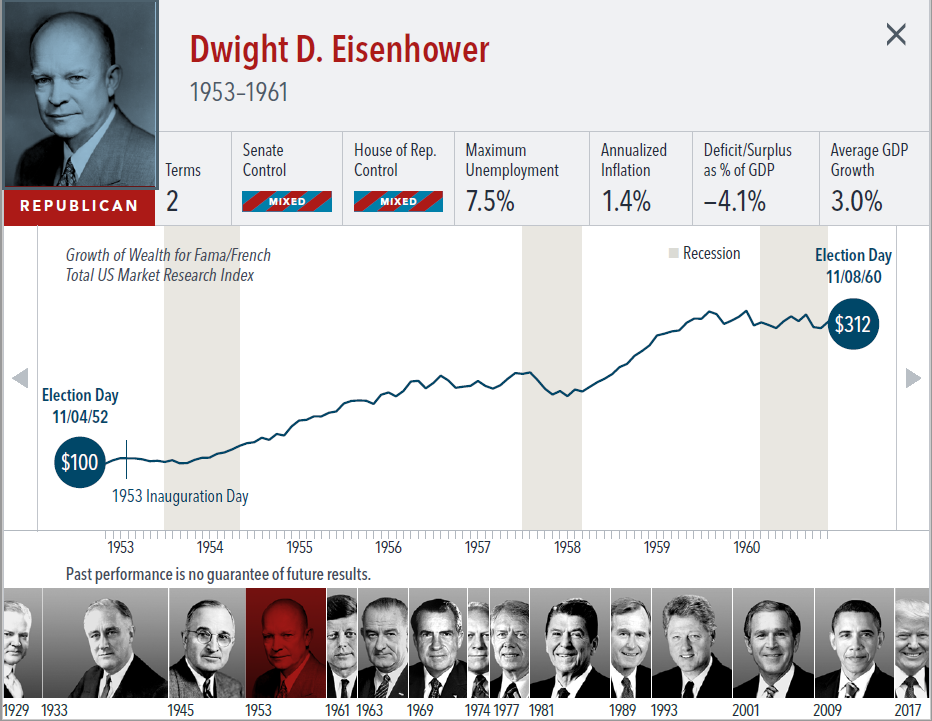
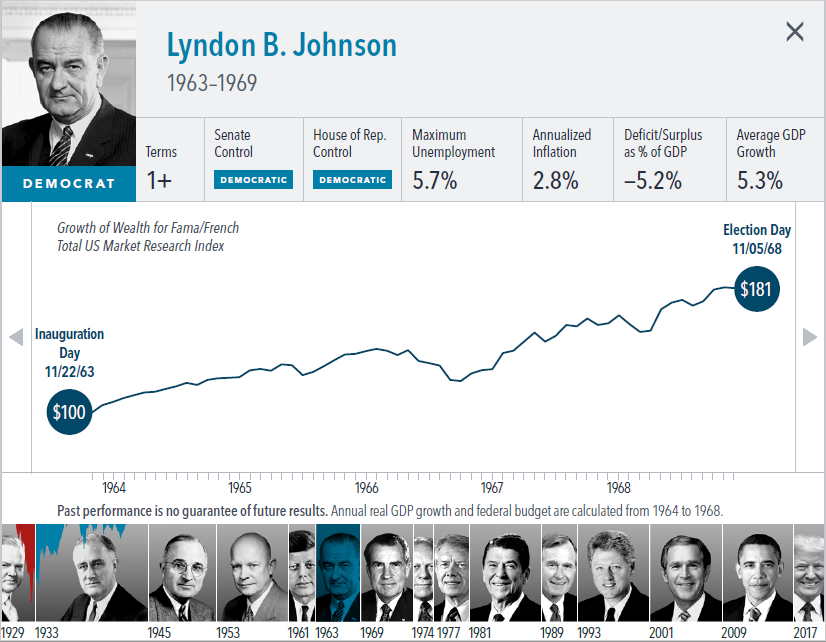
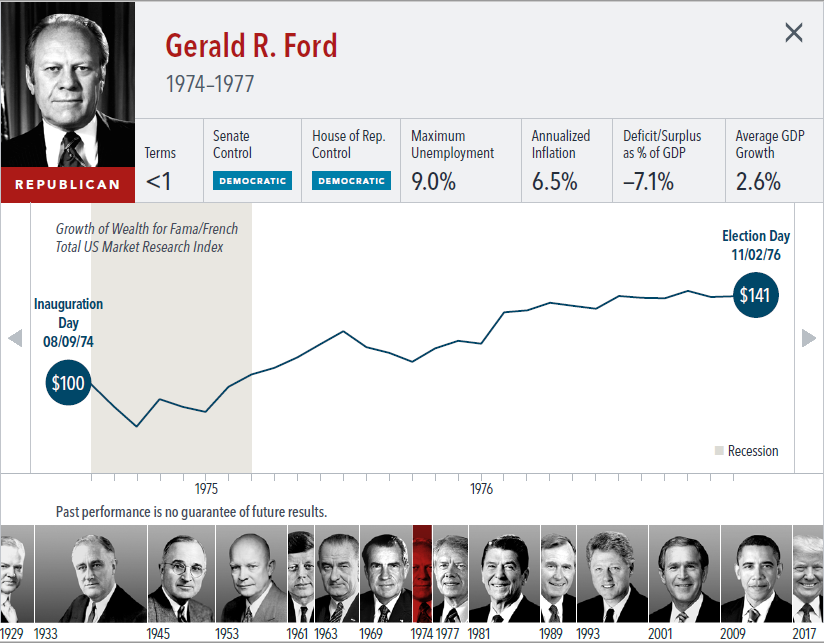
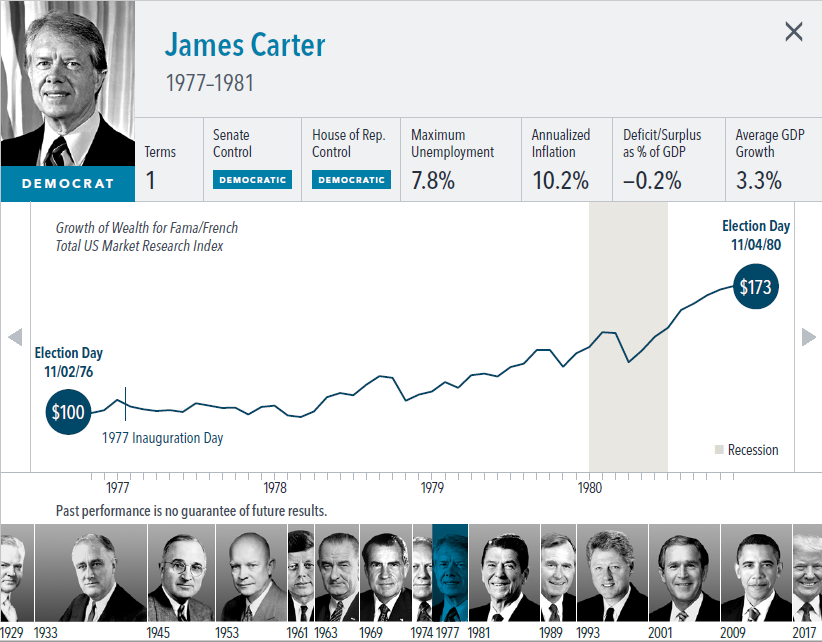
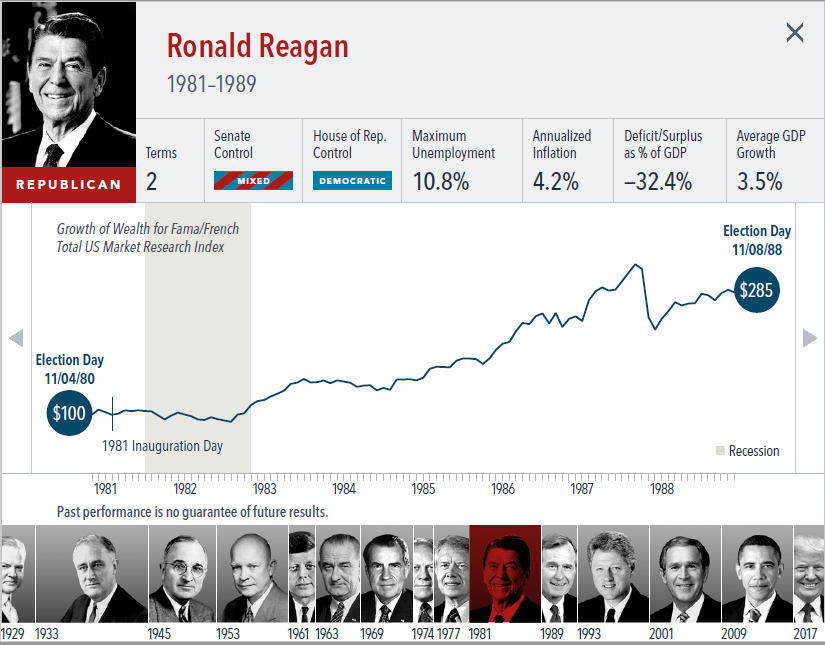
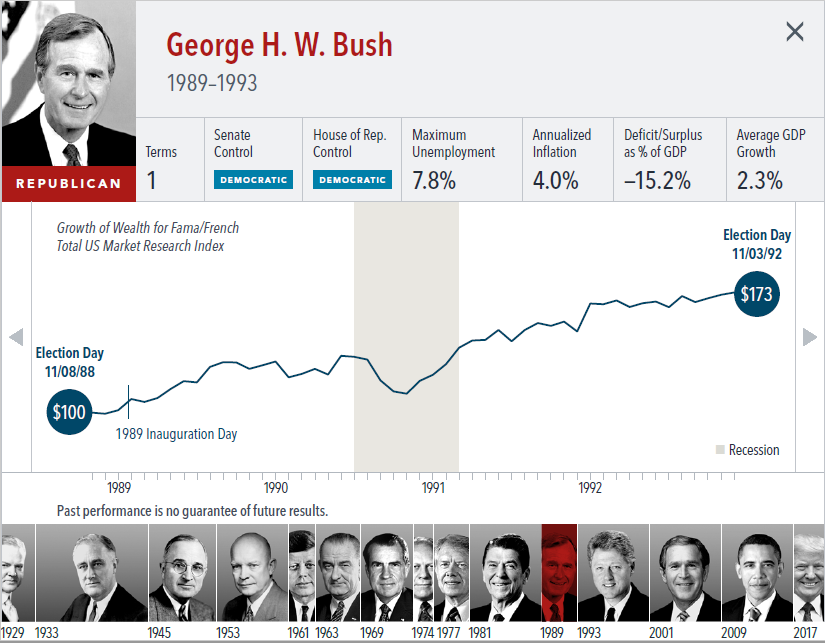
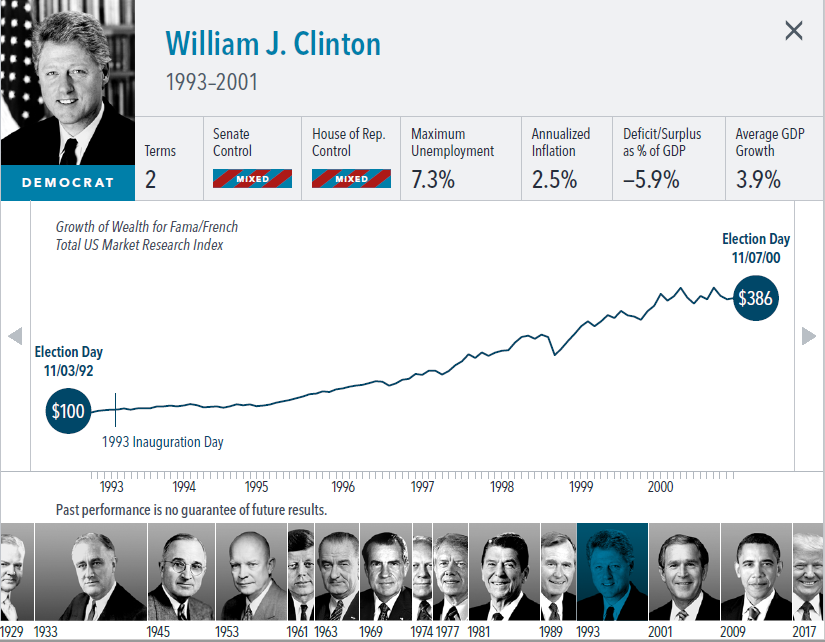
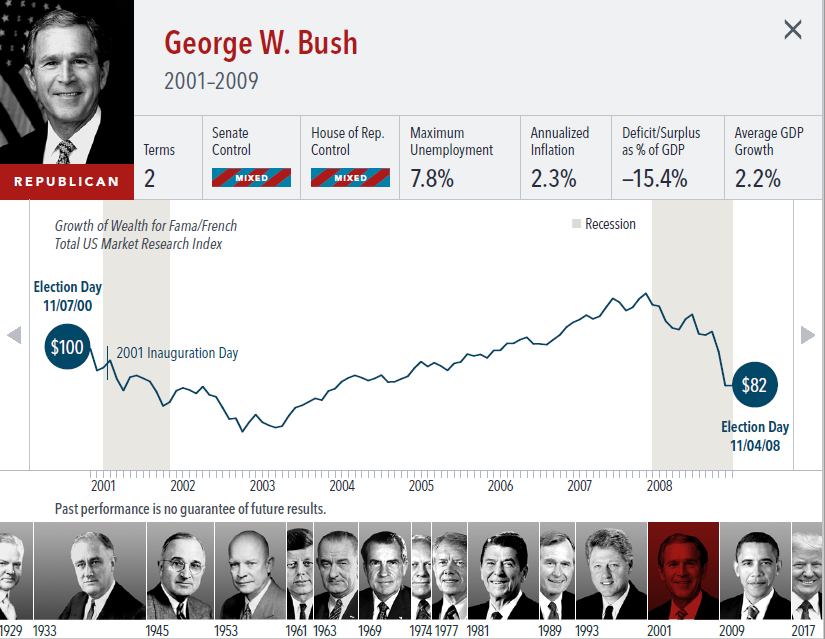
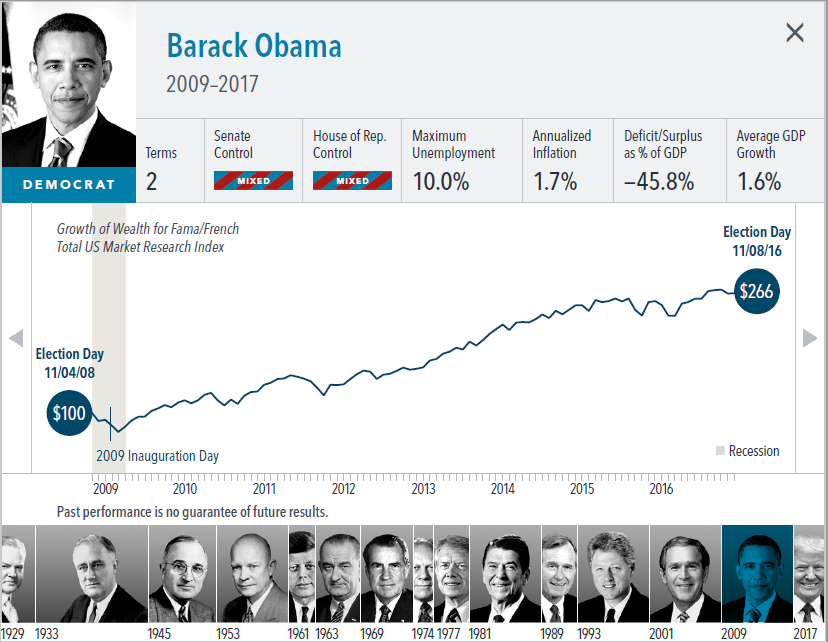
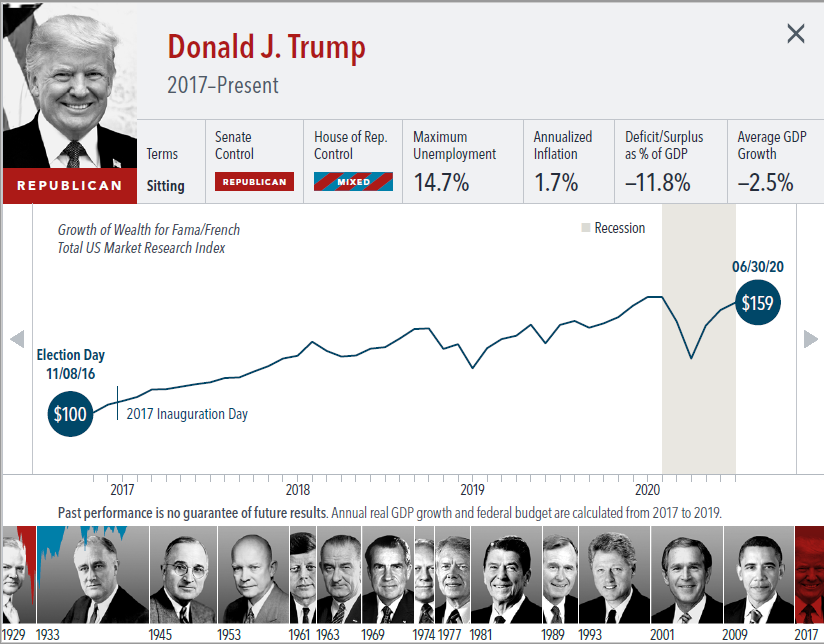
The anticipation building up to elections often brings with it questions about how financial markets will respond. But the outcome of an election is only one of many inputs to the market. Our interactive exhibit examines market and economic data for nearly 100 years of US presidential terms and shows a consistent upward march for US equities regardless of the administration in place. This is an important lesson on the benefits of a long-term investment approach.


NOTES AND DATA SOURCES
• This material is in relation to the US market and contains analysis specific to the US.
• In US dollars. Stock returns represented by Fama/French Total US Market Research Index, provided by Ken French and available at http://mba.tuck.dartmouth.edu/ pages/
faculty/ken.french/data_library.html. This value-weighed US market index is constructed every month, using all issues listed on the NYSE, AMEX, or Nasdaq with available
outstanding shares and valid prices for that month and the month before. Exclusions: American depositary receipts. Sources: CRSP for value-weighted US market return.
Rebalancing: Monthly. Dividends: Reinvested in the paying company until the portfolio is rebalanced.
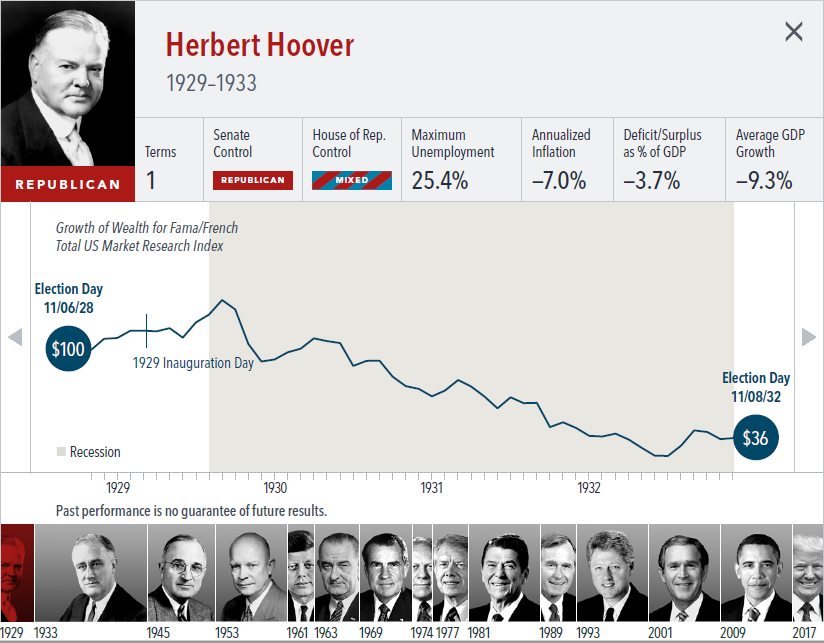
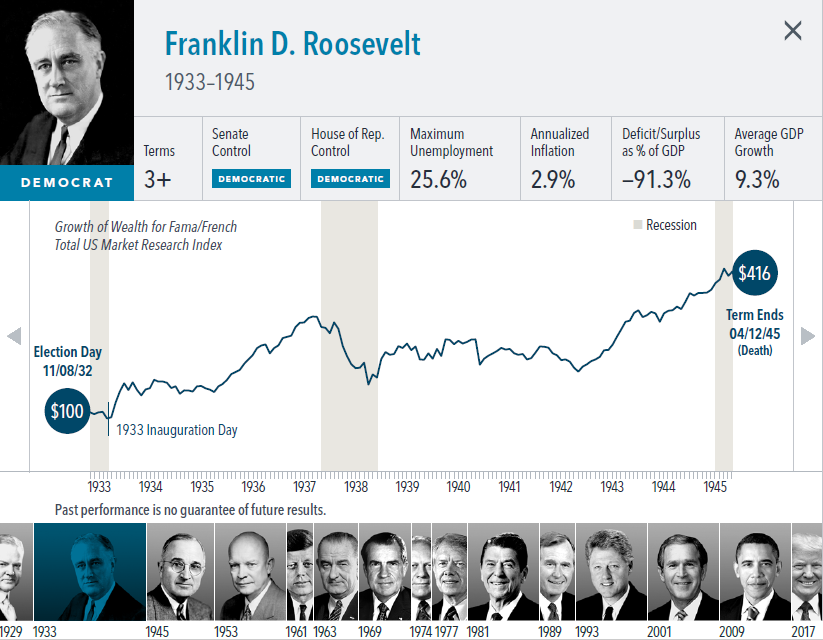
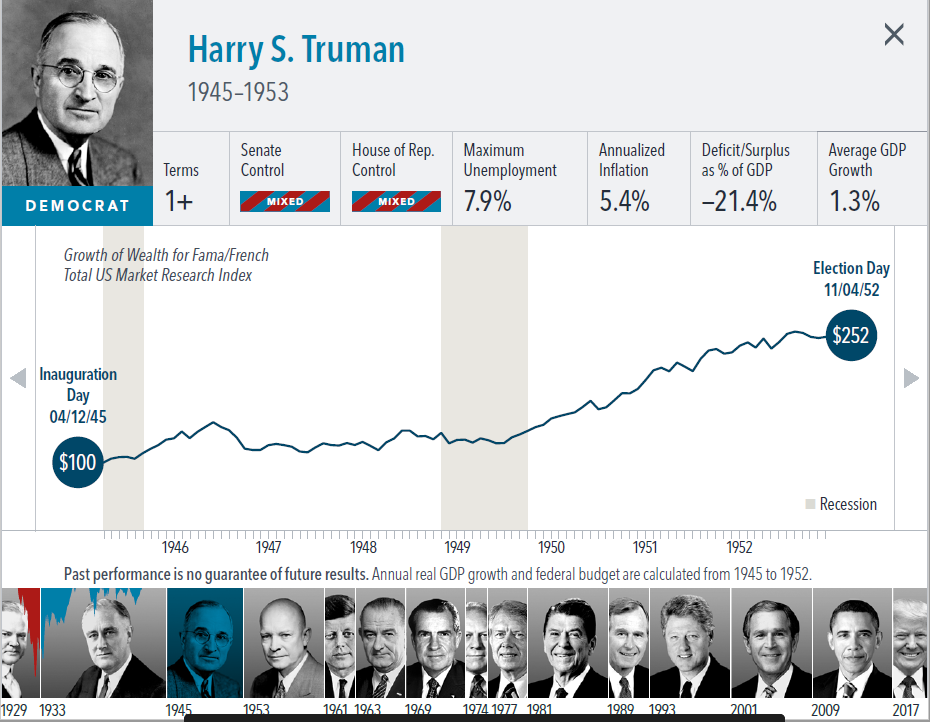
• Growth of wealth shows the growth of a hypothetical investment of $100 in the securities in the Fama/French US Total Market Research Index. Growth of wealth for the full
sample from March 4, 1929, through June 30, 2020. Growth of wealth for each presidential term starts on the election day of each president up to but not including the
election day of a successor. For presidents who are not initially elected, the growth of wealth period starts from the day of inauguration up to but not including the successor’s
election day.
• Federal surplus or deficit as a percentage of gross domestic product, inflation, and unemployment data from Federal Reserve Bank of St. Louis (FRED). GDP Growth is annual
real GDP Growth, using constant 2012 dollars, as provided by the US Bureau of Economic Analysis. Unemployment data not reported prior to April 1929. Federal surplus or
deficit as a percentage of gross domestic product data is cumulative.
• US Government Presidential and Congressional data obtained from the History, Art & Archives of the United States House of Representatives. US Senate data is from the
Art & History records of the United States Senate.
• For Herbert Hoover, the federal budget is calculated from 1929 to 1932. Annual real GDP growth is calculated from 1930 to 1932; GDP data not available prior to 1930.
Sources: Dimensional Fund Advisors LP is an investment advisor registered with the Securities and Exchange Commission.